The Data Integration Problem: How to Connect Your Ecommerce, Marketing, and Analytics Without Losing Your Mind
Last updated: April 2026
Your Shopify store knows what people buy. Google Analytics knows how they found you. Meta Ads Manager knows what you spent to get them there. Klaviyo knows which emails they opened. QuickBooks knows how much revenue actually hit your bank account. And the Google Sheet that your operations manager updates every Friday knows which products are backordered.
Each of these systems is doing its job. The problem is that none of them talk to each other. And the questions that actually drive your business forward, questions like “What is our true customer acquisition cost across all channels, accounting for returns?” or “Which marketing campaigns bring customers who reorder within 90 days?” or “Is the increase in ad spend actually producing profitable revenue, or just revenue?”, require data from three, four, or five of those systems combined.
This is the data integration problem, and it is the single most common bottleneck for small and mid-sized businesses trying to get value from their analytics. A 2026 market research report found that 41 percent of businesses cite data integration challenges as the primary barrier limiting their analytics implementation. Not a lack of data. Not a lack of tools. The inability to connect what they already have.
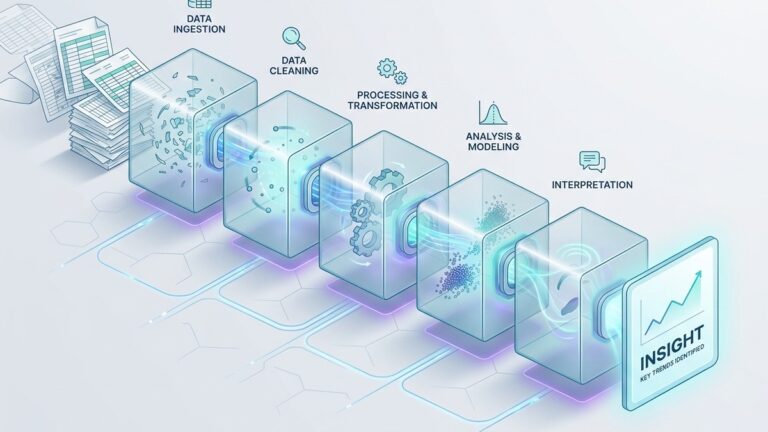
This guide walks through why integration is so difficult in practice, what the realistic options look like in 2026, and how to build a connected analytics setup without hiring a data engineering team.
Why your data lives in silos (and why it is not your fault)
The first thing to understand is that data fragmentation is a feature of how modern business software works, not a failure of planning. Every SaaS tool you use is designed to be the best at one thing. Shopify is excellent at running an online store. Mailchimp is excellent at sending email campaigns. Google Analytics is excellent at tracking website behavior. None of them are designed to give you a unified view of your business.
This was not always the case. Fifteen years ago, a small business might have run everything through a single system, perhaps a monolithic ERP or even just QuickBooks plus a spreadsheet. The data was limited, but at least it lived in one place. The explosion of specialized SaaS tools over the past decade gave businesses dramatically better capabilities in every function, but it also fragmented data across dozens of disconnected systems.
The average online retailer in 2026 uses between 15 and 30 different software applications, according to a comprehensive integration guide published by ReferralCandy. Each of those applications collects data in its own format, uses its own identifiers, and exposes that data through its own (often limited) reporting interface. The customer who bought from your Instagram Shop, received a follow-up email, joined your loyalty program, and then referred three friends exists as a separate, disconnected record in each of those systems.
The result is that small teams end up doing one of two things. They either give up on cross-system analysis entirely and make decisions based on whichever single tool they happen to have open, or they spend hours every week manually exporting CSVs, copying data between spreadsheets, and trying to reconcile numbers that never quite match. Neither approach works. The first leads to decisions based on incomplete information. The second is unsustainable and error-prone.
The five data sources every small business needs to connect
Before diving into solutions, it helps to map the landscape. Most small businesses, particularly those in ecommerce or digital services, have data spread across five functional categories. Understanding what each category contains and what it cannot tell you on its own is the foundation of a good integration strategy.
1. Ecommerce and transaction data
Where it lives: Shopify, WooCommerce, BigCommerce, Stripe, Square, PayPal, or your custom-built store.
What it knows: Orders, products, customers, revenue, refunds, shipping, taxes, and payment status. This is the financial backbone of your business and usually the most structured and reliable data source you have.
What it cannot tell you alone: How those customers found you, what marketing drove the purchase, whether the customer engaged with your content before buying, or how their lifetime value compares across acquisition channels. Transaction data tells you what happened but not why.
2. Marketing and advertising data
Where it lives: Google Ads, Meta Ads Manager (Facebook and Instagram), TikTok Ads, LinkedIn Campaign Manager, and any other paid media platforms you use.
What it knows: Impressions, clicks, spend, cost per click, and platform-reported conversions. Each ad platform tracks its own version of what it considers a conversion, using its own attribution model and its own tracking pixel.
What it cannot tell you alone: Whether the conversions it reports actually resulted in revenue. Ad platforms are notorious for overcounting conversions because they each take credit for any purchase that touched their channel. If a customer clicked a Google ad, then a Facebook ad, then bought something, both platforms will report a conversion. Your transaction data shows one sale. Reconciling ad platform data with actual revenue is one of the most important and most difficult integration tasks for any business running paid media.
3. Website and product analytics
Where it lives: Google Analytics (GA4), Mixpanel, Amplitude, Hotjar, or your web hosting platform’s built-in analytics.
What it knows: Sessions, page views, user flows, bounce rates, time on site, device types, geographic location, and (increasingly limited) referral source data. GA4 also provides event-based tracking for specific user actions like add-to-cart, begin-checkout, and purchase.
What it cannot tell you alone: Whether a session led to actual revenue (GA4 can estimate this with ecommerce tracking, but the numbers rarely match your transaction system exactly). It also cannot tell you anything about what happens after the purchase: retention, repeat purchases, lifetime value, or support interactions. Website analytics captures the consideration and conversion phases of the customer journey but misses everything before (ad exposure, email opens) and after (retention, referrals).
4. Email and CRM data
Where it lives: Klaviyo, Mailchimp, HubSpot, ActiveCampaign, Salesforce, or a simple contact list in Google Sheets.
What it knows: Email addresses, open rates, click-through rates, subscriber segments, campaign history, lead scores (if you use a CRM), and customer communication history. In more sophisticated setups, the CRM also tracks sales pipeline stages, deal values, and customer interactions across channels.
What it cannot tell you alone: Whether email engagement actually correlates with purchases. A customer who opens every email but never buys is very different from one who opens nothing but purchases quarterly. Making that distinction requires connecting email data with transaction data, which is exactly the integration step most teams skip.
5. Financial and operational data
Where it lives: QuickBooks, Xero, FreshBooks, or your bank’s transaction feed, plus whatever inventory management system you use (often a spreadsheet).
What it knows: Actual cash received, costs of goods sold, operating expenses, inventory levels, supplier costs, and margins. This is the source of truth for profitability. Everything else is proxy metrics.
What it cannot tell you alone: Anything about customer behavior, marketing effectiveness, or product trends. Financial data tells you the outcome but not the causes. Connecting financial data with marketing and transaction data is how you answer the question that actually matters: “Are we making money, and if so, from what?”
The integration approaches available in 2026
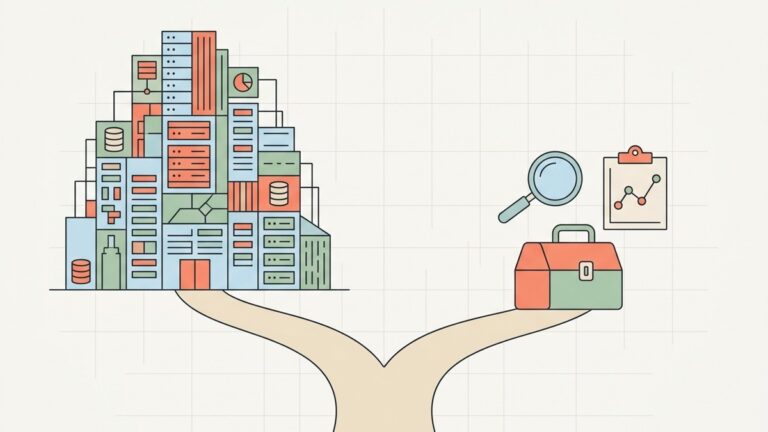
There are four realistic ways to connect these data sources, ranging from manual and free to automated and expensive. Each has a place depending on your team size, technical capacity, and budget.
Approach 1: Manual exports and spreadsheets
How it works: Export CSVs from each system, import them into Google Sheets or Excel, and use VLOOKUP, INDEX/MATCH, or pivot tables to combine them manually.
Cost: Free (in terms of software).
Time cost: High. Depending on the number of sources and complexity, expect 2 to 8 hours per week to maintain a manually integrated dataset for a small business.
When it makes sense: If you have fewer than three data sources, your data volumes are small (hundreds or low thousands of rows), and you need cross-system analysis on a weekly or monthly cadence rather than in real time. Many businesses start here, and some stay here permanently because the volume does not justify anything more complex.
When it breaks down: When anyone other than the person who built the spreadsheet needs to use it. When a column name changes in one of the exports and the formulas silently break. When you realize that VLOOKUP cannot handle the fact that Shopify calls them “customers” and Mailchimp calls them “contacts” and the email addresses do not always match because one system lowercased them and the other did not.
Approach 2: ETL pipelines (the modern data stack)
How it works: A dedicated ETL (Extract, Transform, Load) or ELT tool pulls data from your source systems automatically, loads it into a cloud data warehouse (like Snowflake, Google BigQuery, or Amazon Redshift), and a transformation layer (typically dbt) cleans and structures the data for analysis. A BI tool like Tableau, Power BI, or Looker sits on top for visualization.
The two dominant ETL platforms in 2026 are Fivetran and Airbyte. Fivetran is fully managed, with over 500 pre-built connectors for common SaaS tools including Shopify, Google Ads, Meta Ads, Stripe, and most CRMs. It is reliable and requires minimal maintenance, but its consumption-based pricing (billed by monthly active rows) can become expensive quickly, particularly for ecommerce businesses with high transaction volumes. Airbyte is open-source with a cloud option, offering over 600 connectors. It provides more flexibility and lower costs at scale, but requires more technical oversight, especially if you self-host.
Cost: Significant. Fivetran pricing starts with a free tier for small volumes but scales to $500 to $2,000+ per month for a typical small business data stack. Add the warehouse cost ($100 to $500/month for BigQuery or Snowflake at small scale), the dbt hosting or engineering time for transformations, and the BI tool license ($10 to $75/user/month). A functional modern data stack costs $800 to $3,000 per month for a small team, plus the time of someone technical enough to set it up and maintain it.
When it makes sense: When your data volumes are large enough (millions of rows), your source systems are numerous enough (five or more), and your analysis is sophisticated enough to justify the investment. Also when you have at least one person on the team who is comfortable with SQL and data modeling.
When it breaks down: When nobody on the team can write SQL. When the monthly cost exceeds what the business can justify from analytics improvements. When the pipeline breaks at 2 AM on a Saturday and nobody knows how to fix it. The modern data stack is powerful, but it was designed for companies with data engineers. For a team of 10 without one, it is often overkill.
Approach 3: Analytics platforms with built-in integration
How it works: Instead of building a pipeline yourself, you use a platform that connects to your data sources directly, handles the merging and structuring internally, and provides analysis and visualization in one interface. This category has grown significantly in the past two years as vendors recognized that most small businesses cannot and should not build a data warehouse.
Power BI supports direct connections to a wide range of sources, but requires someone comfortable with data modeling and the DAX formula language to get real value from multi-source integration. Tableau offers similar capabilities at a higher price point and with a steeper learning curve. Both are excellent tools for teams that have at least one analytically skilled person, but neither automatically solves the integration problem. You still have to define how the data sources relate to each other.
Platforms that handle integration more automatically are increasingly relevant for teams without technical staff. QuantumLayers has a detailed technical overview of the multi-source ingestion challenge that explains the different connection methods (database connections, API integration, file uploads, SFTP, and Google Sheets) and how schema alignment works when combining data from sources that use different formats and identifiers. The challenge of matching a “customer_id” in your transaction system with a “contact_email” in your CRM with a “user_id” in your analytics platform is a genuinely hard problem, and how a platform handles it determines whether the merged dataset is trustworthy or subtly corrupted.
Cost: Varies widely. Power BI starts at $10/user/month. Tableau starts at $75/user/month. Newer platforms vary from free tiers to $100 to $500/month depending on data volume and features.
When it makes sense: When you need multi-source analysis, your team is small, and you want to avoid the cost and complexity of building your own data pipeline. This is the sweet spot for most small to mid-sized businesses in 2026.
Approach 4: Custom code and scripts
How it works: A developer on your team writes Python or JavaScript scripts that pull data from each source’s API, merge it into a database, and either generate reports directly or feed a BI tool. This is the bespoke approach, infinitely customizable but entirely dependent on the person who wrote the code.
Cost: No software cost beyond hosting (a small server or serverless function). High labor cost in engineering time, both upfront and ongoing.
When it makes sense: When you have very specific integration requirements that no off-the-shelf tool handles, or when you have a developer who is more comfortable writing code than configuring platforms. Some businesses also use custom scripts as a bridge while evaluating more permanent solutions.
When it breaks down: When the developer who wrote the scripts leaves. When an API changes and the pipeline silently starts dropping data. When the business needs grow beyond what a single developer can maintain alongside their other responsibilities.
The three integration problems that actually matter
Regardless of which approach you choose, three technical problems determine whether your integrated data is trustworthy. These are the issues that cause the numbers in your dashboard to not match the numbers in your accounting system, and they deserve more attention than most integration guides give them.
Problem 1: Identity resolution
Your customer is one person. Your systems see them as many. They placed an order on Shopify with their personal email. They signed up for your newsletter with their work email. They left a review under a shortened version of their name. Google Analytics tracked them as three separate sessions across two devices. Meta Ads knows them only as a hashed identifier in an audience segment.
Identity resolution is the process of connecting these fragmented records into a single customer profile. It is the foundational requirement for any cross-system analysis. Without it, you cannot accurately calculate customer lifetime value, you cannot attribute revenue to marketing channels, and you cannot measure retention.
At the enterprise level, identity resolution is handled by Customer Data Platforms (CDPs) like Segment or mParticle, which use probabilistic and deterministic matching to unify customer profiles. For small businesses, these tools are typically too expensive and too complex.
The practical alternative is to pick one identifier that exists across most of your systems (usually email address) and use it as your primary merge key. This will not capture every customer (some will have used different emails), but it will correctly unify the majority and give you a working dataset for cross-system analysis. You can always refine the matching logic later. Getting 80 percent of identities resolved correctly is dramatically more valuable than waiting for a perfect solution.
Problem 2: Attribution and double counting
Every marketing platform wants credit for your sales. This is not a conspiracy. It is a structural consequence of how attribution works. Google Ads uses its own attribution model that gives credit to clicks within its ecosystem. Meta Ads does the same for its ecosystem. Your email platform credits opens and clicks that preceded a purchase. If a customer saw a Facebook ad, clicked a Google ad, opened an email, and then bought something, all three platforms will report a conversion. But you only made one sale.
Reconciling these competing attribution claims is one of the most important reasons to integrate your data. When your ad platforms live in silos, you sum their reported conversions and conclude that you had 500 sales from paid channels last month. When you check your transaction system, you had 320. The 180-sale gap is double (and triple) counting.
The fix is to use your transaction system as the source of truth for actual revenue and use marketing data to understand influence, not to count conversions. In an integrated dataset, you join transaction records with marketing touchpoints and apply a single attribution model that you control, rather than relying on each platform’s self-serving default.
Google’s own documentation on attribution acknowledges the limitations of platform-specific attribution and encourages businesses to use their own data for cross-channel comparison. The problem is that doing so requires the integration that most businesses do not have.
Problem 3: Schema alignment and data freshness
Your Shopify store records timestamps in UTC. Your Google Ads account reports in the timezone you configured (probably US Eastern or Pacific). Your email platform might report campaign sends in one timezone and engagement metrics in another. Your bank records transactions on the settlement date, which is one to three business days after the purchase date.
These misalignments seem trivial. They are not. A revenue analysis that attributes a Thursday purchase (Shopify timestamp) to a Wednesday ad click (Google Ads timestamp in a different timezone) will produce incorrect attribution. Joining daily revenue from your bank with daily ad spend from Google Ads will show misalignment during every settlement lag. And if your Google Sheets operational data is updated on Fridays but your other systems report in real time, the integrated view is inconsistent for most of the week.
Schema alignment is the process of standardizing these formats, identifiers, and timing conventions before the data is merged. It includes normalizing timezones, reconciling currency formats, standardizing category names (is it “T-Shirt” or “T-shirt” or “Tshirt” or “Apparel > Tops > T-Shirts”?), and handling the inevitable nulls and missing fields that appear when one system has data that another does not.
QuantumLayers has written about the importance of data quality in the context of AI-driven analytics, and the point applies equally to any integration scenario: inconsistent, duplicate, or misformatted data does not just produce inaccurate reports. It produces reports that look accurate, which is worse. A dashboard that shows a number you know is wrong can be questioned. A dashboard that shows a plausible-looking number that is subtly wrong gets acted on.
A practical integration roadmap for small teams
If you are a team of five to twenty people without a data engineer, here is a realistic path to connecting your data sources without overengineering the solution.
Map your sources and define your questions.
Write down the five to seven business questions that would be most valuable to answer. For each question, identify which data sources contain the relevant information. You will likely find that 80 percent of your important questions require data from just two or three systems. Those are the integrations to prioritize.
Establish your source of truth.
Pick one system as the canonical record for each core entity: your ecommerce platform for transactions, your CRM for customer records, your accounting software for financial data. When numbers conflict across systems (and they will), you need a clear hierarchy for which system wins.
Build your first integration.
Start with the single most valuable join: typically, connecting your transaction data with your marketing data so you can see actual revenue by acquisition channel rather than platform-reported conversions. If you are using manual exports, this means a weekly spreadsheet that merges the two sources on email address or transaction ID. If you are using a platform with built-in integration, this means connecting both sources and configuring the merge.
Add the second layer.
Once your transaction-to-marketing integration is stable, add your email/CRM data. This gives you the ability to see the full funnel: which campaigns drove engagement, which engagements led to purchases, and which purchases led to repeat customers.
Iterate and automate.
Now that the structure exists, focus on reducing manual work. Replace CSV exports with API connections where possible. Set up scheduled reports that deliver the integrated view automatically. Add new data sources as your questions evolve.
The temptation is to try to connect everything at once. Resist it. Each integration introduces complexity: new merge keys to manage, new schema misalignments to handle, new data freshness considerations to account for. Building incrementally lets you validate each connection before adding the next one.
What good integration looks like in practice
You will know your integration is working when certain things become easy that used to be hard.
Answering “What is our true customer acquisition cost by channel?” should take seconds, not a day of spreadsheet work. Spotting that a high-spending ad campaign is driving revenue but not profit should be visible from a single dashboard that combines ad spend, transaction data, and cost of goods sold. Identifying which customer segment has the highest lifetime value should be answerable from integrated data, not from gut feel based on who your sales team talks to most.
Good integration also makes the problems visible. When your data is in silos, you do not even know that your Google Ads conversion count does not match your actual sales count. When it is integrated, the gap is obvious, and you can investigate why. Seeing the discrepancies is the first step toward fixing them.
The bar is not perfection. The bar is having one place where your most important business data comes together, updated regularly, with enough accuracy to make better decisions than you would make without it. For most small businesses in 2026, that is achievable without a data warehouse, without a data engineer, and without a six-figure analytics budget. It just requires picking the right tools, starting with the highest-value connections, and building the habit of looking at integrated data every week.
Lurika is an independent publication covering data analytics for non-technical teams. We are not owned by any analytics vendor.