Black Friday Sales Analysis: How Much of the Spike Was Real?

Chart of daily sales spiking above a dashed baseline during Black Friday, with red dips before and after the event

The Black Friday revenue spike mixes new demand with sales borrowed from the weeks around it and discounts given to people who would have paid full price. Here is how to separate them with your own order data, a worked profit example, and what to record before this year's event.
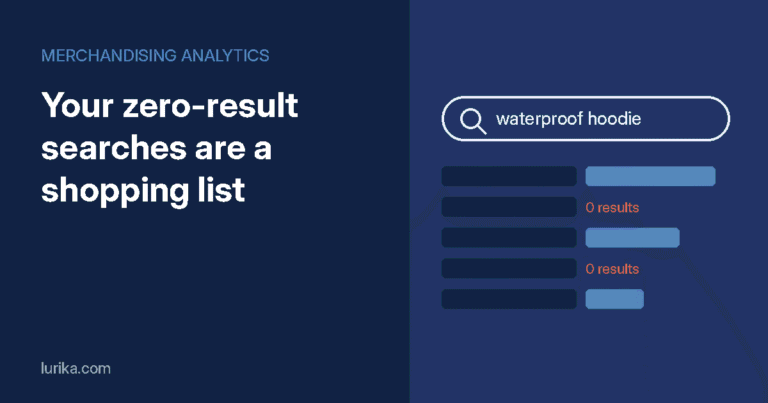
Site Search Analytics: Your Zero-Result Searches Are a Shopping List

A store search box with a query, above a list of search results where two rows show zero results

Your search box is the one place shoppers tell you, in their own words, what they want. Here is what WooCommerce, Magento and GA4 actually record about searches, the blind spots in each, how to log result counts, and a way to sort zero-result terms into fixes and buying decisions.

How to Set a Free Shipping Threshold From Your Own Order Data

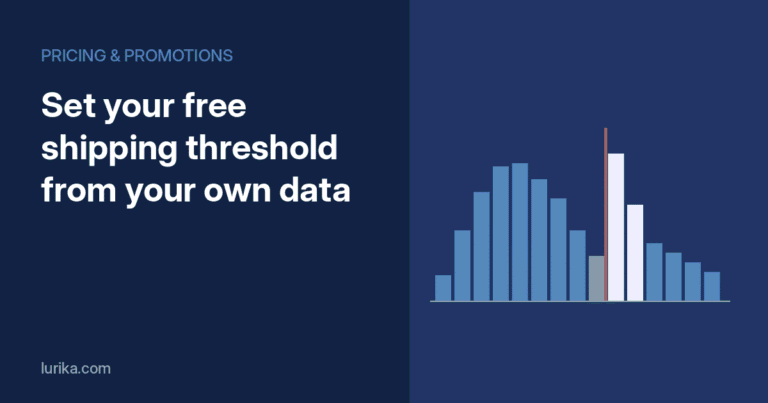
Order value histogram with a red free shipping threshold line and a pile of orders just above it

The usual rule for a free shipping threshold is a percentage above average order value. Your order value histogram can do better: it shows whether shoppers already top up to reach your threshold, how many orders sit just below it, and where contribution per visitor peaks.