Why Most Small Businesses Fail at Analytics (And How to Fix It)
Last updated: April 2026
Every small business collects data. Very few small businesses actually use it.
The numbers are striking. According to a BARC Research survey, roughly half of companies report having inadequate analytical or technical know-how, and 38 percent still can’t identify a compelling business case for their data initiatives. A Gartner study found that 54 percent of marketing leaders are dissatisfied with their analytics. These aren’t small companies with tiny datasets. They’re organizations that have invested in tools, hired people, and still can’t get from numbers to decisions.
For small businesses, the situation is even more acute. You have fewer resources, less technical expertise, and less room for error. The data is there: your CRM has customer records, your ad platforms have campaign metrics, your POS system has transaction logs, and your accounting software has revenue figures. But the gap between having data and having insight is enormous, and most small businesses fall into the same traps on the way across.
Here are the most common reasons it goes wrong, and what to do about each one.
1. Collecting everything, understanding nothing
The first instinct most businesses have when they start thinking about analytics is to collect more data. Install more tracking. Add more fields to the CRM. Export more reports. The assumption is that more data equals more insight.
It doesn’t. More data, without a clear question to answer, just means more noise. You end up with dozens of spreadsheets, dashboards full of metrics nobody checks, and a vague sense that the information you need is “in there somewhere” but impossible to find.
The fix is unglamorous but effective: start with the question, not the data. Before you add a single tracking pixel or connect a new data source, write down the three to five business questions you need answered. “Which marketing channel brings our highest-value customers?” is a question. “We should track everything” is not.
Ascend Analytics has a useful framework for thinking through what small businesses should prioritize, and the core principle applies universally: focus on answering “so what?” If a metric doesn’t lead to an action you can take, it doesn’t need to be on your dashboard.
2. Data lives in silos that never talk to each other
This is the most common structural problem and possibly the most damaging. Your sales data lives in your CRM. Website traffic is in Google Analytics. Email campaign performance is in Mailchimp. Financial data is in QuickBooks. Social media metrics are spread across three different platforms.
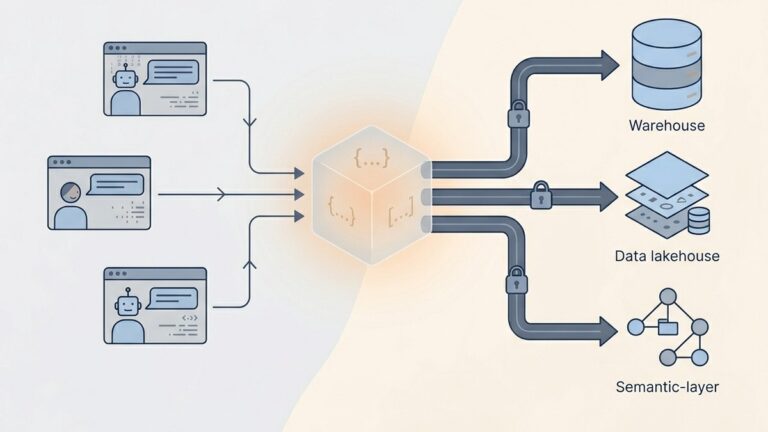
Each of these systems tells you something useful in isolation. But the questions that actually matter (“Which customers are most profitable?”, “What’s our true cost of acquisition across all channels?”, “Which products are trending upward and why?”) require data from multiple sources combined together. And for most small businesses, that combining step never happens because it requires either manual spreadsheet work that nobody has time for or a data engineer that nobody can afford.
This is where the analytics tooling landscape has shifted most dramatically in the past two years. Platforms like Zoho Analytics, Power BI, and newer entrants are making multi-source data integration more accessible to non-technical teams. The key is to choose a tool that connects to your actual data sources (not just the ones listed on the marketing page) and handles the merging automatically rather than requiring you to build data models by hand.
If you want to understand the technical side of why joining data from multiple sources is so difficult, QuantumLayers has a detailed explanation of the data ingestion challenge that’s worth reading regardless of which tool you end up choosing.
3. Mistaking correlation for causation
This one is subtle and dangerous because it feels like good analytics. You look at the data, spot a pattern, and take action. The problem is that not every pattern is meaningful.
A classic example: your sales spike every time you send a newsletter. You conclude the newsletter drives sales and double your email frequency. But the real driver was seasonal demand, and the newsletters just happened to go out on the same cycle. Now you’re sending twice as many emails, your unsubscribe rate is climbing, and the sales bump was going to happen anyway.
DataSI’s guide on common analytics mistakes puts it well: correlation shows the relationship between two variables, while causality suggests one causes the other. The distinction matters enormously when you’re making budget decisions.
The fix isn’t to stop looking for patterns. It’s to test your assumptions before acting on them. If you think your newsletter drives sales, run an A/B test: send it to half your list one week and see if the half that received it actually buys more. If you think a specific ad channel brings higher-value customers, tag those customers in your CRM and track their lifetime value over six months rather than relying on a single week’s conversion data.
4. Buying a tool and expecting it to solve the problem
This is the trap that analytics vendors would prefer you didn’t think about too carefully. The industry runs on the promise that the right tool will transform your data into insight automatically. And while the tools have gotten dramatically better (AI-powered analysis is real and useful, not just a marketing buzzword), a tool is only as good as the data you feed it and the questions you ask it.
The pattern looks like this: the team gets excited about a new analytics platform, someone spends a few days setting it up, everyone looks at the dashboards for a week, and then gradually nobody checks them anymore. Three months later, the subscription auto-renews, and the CEO asks why they’re paying for something no one uses.
The failure isn’t the tool. The failure is treating analytics as a project rather than a habit. A dashboard that gets checked weekly and leads to one small decision each time is infinitely more valuable than a sophisticated analytics suite that gets ignored.
If you’re evaluating tools, the most important question isn’t “what features does it have?” It’s “will my team actually use this every week?” That often means choosing a simpler tool that fits your current workflow over a powerful one that requires a behavior change nobody is motivated to make.
5. No one owns the analytics function
In a 200-person company, there’s usually someone whose job title includes “analytics” or “data.” In a 10-person company, analytics is everyone’s job and therefore nobody’s job.
When nobody is responsible for maintaining data quality, reviewing reports, and translating insights into recommendations, analytics atrophies. The CRM fills up with duplicate records. The Google Analytics property stops being checked. The monthly report that someone used to assemble in a spreadsheet quietly stops getting made when that person gets pulled onto other work.
The fix doesn’t require a full-time hire. It requires assigning ownership. Pick one person, give them two hours per week specifically for analytics, and hold them accountable for producing a short weekly summary: what happened, what changed, and what should we do about it. This is more valuable than any tool or technology investment because it creates the habit loop that makes analytics actually function.
6. Treating data quality as an afterthought
You can have the best analytics platform in the world and the most data-literate team, and still make terrible decisions if the underlying data is wrong. Duplicate customer records, inconsistent naming conventions, missing fields, outdated information, and mismatched date formats are the mundane realities of small business data, and they are quietly sabotaging your analysis.
A study cited by OWOX found that scattered reports with conflicting numbers are one of the most common complaints across businesses of all sizes. When your Google Analytics says you had 900 sales but your CRM says 543, you don’t have an analytics problem. You have a data quality problem.
Fixing data quality is tedious work, and that’s exactly why it doesn’t get done. The practical approach is to start small: pick your single most important data source (usually your CRM or your transaction database), deduplicate it, standardize the fields, and set up rules to keep it clean going forward. Then expand from there. Trying to clean all your data at once is how data quality projects die on the vine.
7. Ignoring the “last mile” between insight and action
The final and perhaps most frustrating failure mode is having all the pieces in place (clean data, good tools, someone reviewing the numbers) and still not acting on what the data tells you.
This happens more often than anyone admits. The analytics clearly show that one marketing channel is outperforming the others by a wide margin, but the budget doesn’t shift because “we’ve always done it this way.” The data shows a product category is declining, but nobody wants to be the one to recommend killing it. The churn analysis identifies exactly which customers are at risk, but the sales team is too busy to follow up.
The fix is structural, not technical. Analytics needs to be connected to a decision-making process, not just a reporting process. The weekly analytics review should end with action items, assigned to specific people, with deadlines. If a finding doesn’t lead to a decision, it should at least lead to a deeper question for next week’s review. The worst outcome is a beautifully formatted report that gets emailed to six people and opened by none.
Where to start if you’re starting from scratch
If your business recognizes itself in several of these patterns, resist the urge to fix everything simultaneously. Here’s a practical sequence:
Week 1: Write down three to five business questions you need your data to answer. Be specific. “How is the business doing?” is too vague. “Which of our three ad channels brings customers with the highest 90-day lifetime value?” is specific enough to act on.
Week 2: Identify where the data lives that would answer those questions. Map each question to a data source. If the answer requires combining data from two or more systems, note that.
Week 3: Choose a tool that connects to those specific sources. Don’t pick based on feature lists. Pick based on whether it connects to your actual systems and whether your team will realistically use it.
Week 4: Assign one person to own the weekly analytics review. Give them dedicated time. Start the cadence. It will feel underwhelming at first. That’s fine. Consistency matters more than sophistication.
This sequence won’t make you a data-driven organization overnight. But it will get you further than the alternative, which is buying an expensive tool, using it for two weeks, and going back to making decisions based on gut feel.
The businesses that succeed at analytics aren’t the ones with the most data or the most sophisticated tools. They’re the ones that ask clear questions, maintain clean data, and build the habit of looking at the numbers every week and doing something about what they find.
Lurika is an independent publication covering data analytics for non-technical teams. We are not owned by any analytics vendor.